Cashflow calculations
Cashflow calculations are an essential part of the economic evaluation. The flows of cash in and out during the lifetime of a prospect, through discovery, appraisal, development and abandonment have to be estimated per year (or month). From this the cumnulative cashflow is calculated in money of the day and in terms of present value ("PV"). A cashflow can be calculated "before tax" or "after tax".
The important data for a cashflow calculation (in the case of oil) can be listed as follows:
- Production profile.
- Probabilistic production profile
- Development plan.
- Oil price scenario.
- CAPEX, the capital investment leading to production and eventually abandonment.
- OPEX, the operating expenses during the life of the field.
- Royalties.
- Depreciation
- Taxation, including production bonuses.
- Abandonment costs.
- Present Value Net Cash Surplus
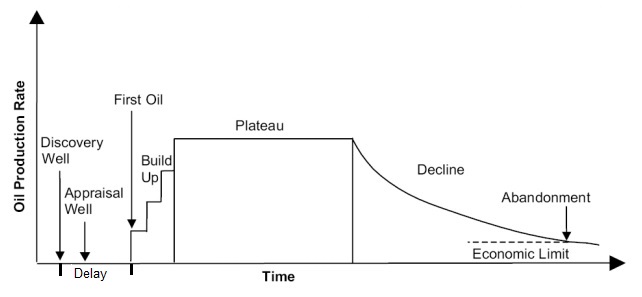
Despite great variation in the way oilfields are developed, there are a number of worldwide rules that can be used to estimate a production profile. The ProdProf program uses the correlation between ultimate recovery of oil and plateau production level (r=0.93), as well as a rough correlation between the ultimate recovery and the build-up time to plateau. Plateau production gives a linear correlation on a log-log plot:
The logic relating ultimate recovery to the three production phases is as follows: The larger the field, the longer it will take to reach the plateau level. On a global scale this is only a weak correlation:
The plateau phase is usually so chosen that at the end of the plateau production half of the ultimate recovery is produced. This includes the volume produced during buildup. Thereafter, the field production declines at some percentage per year. This decline rate is not an arbitrary assumption, but based on the ratio of production over remaining reserves at the end of the plateau. In this way a smooth transition from plateau to decline is ensured. To read more about decline curves, see the paper by H��k et al. (2009). The operators are cought between a desire to produce maximum amounts of oil as soon as possible to increase the PV value of it and the requirement to keep the CAPEX as low as possible and protect the field from unwanted reservoir damage that would limit the U.R. Using this logic and a few assumptions a production profile can be constructed, hence a certain optimal production profile. Here is an example for a 300 mb field with a buildup period of 4.4 years, created with the above simple logic.
For gas fields in the North Sea,I made a survey of the various production parameters and used the results in the prodcasting software.
Capex, or "CAPital EXpenditure" is the money spent (investment) on items that will last for considerable time, such as drilling producctionn wells, installations, pipelines, etc. It forms part of the capital of the company, although it will deminish in value in time by depreciation. It should be visible on the balance sheet as an asset.
Opex, or "OPerating EXpenses" are the costs incurred in the operations, such as staff salaries, materials, energy used, repairs. Opex is an expense in the year that it is incurred and should be visible in the companies Profit and Loss report. It is directly written off against the revenue in the same year.
Depreciation
Depreciation is a means of allocating the cost of a material asset over its useful life. Amortization is the deduction of capital expenses (as "non-cash costs") over a specified time period, typically the life of an asset. Often the cost of a dry exploration well can be deducted from revenue in the year that the cost was incurred. These cost are "expensed", which reduces the tax paid, compared to "capitalized" costs of e.g. production wells. The latter are presumed to have a useful life. The costs can be amortized over that life, for instance at 10% per year.
Abandonment
The host government may, or will normally require the operator to remove offshore structures, as well as onshore facilities at the end of their productive lives. The treatment of the costs incurred by "decommissioning" is in some cases organized in such a way that companies may reserve money for this purpose at the start, with some fiscal advantages. A survey of many websites dealing with the abandonement problems can be found at offshore-environment.An interesting recent development is that not removing offshore installations has advantages. It may be possible to leave a structure where it is as a welcome artifical rif that promotes biological diversity. Also, the wells in an abandoned field may be used in a CCS scheme, or the structure can host facilities for offshore windmill parks.
The PVNCS is the most important end result of the cashflow calculation. The procedure is here illustrated by an oilfield in the North Sea, where the whole life of the field is shown from 1979 till end of production in 2009. First a production profile is estimated by a certain rule. In the following graph is also shown the true production over a number of years to show how well the "rule of thumb", (the ProdProf progam) is estimating the yearly production.
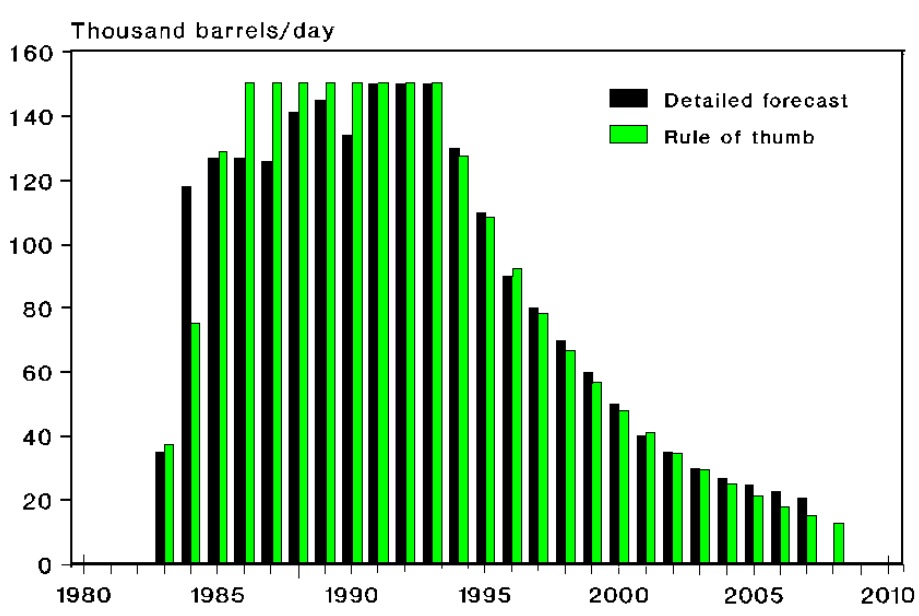
The other variables are used to get the yearly cashflows (positive or negative) for the life of the field. The cashflows are calculated in the money of the day as well as in PV terms.
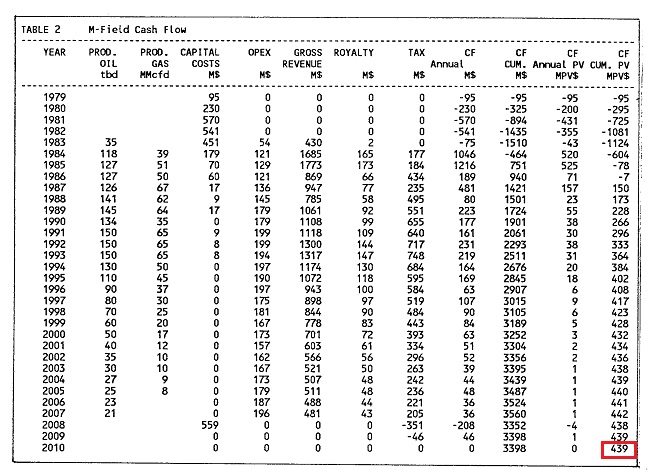
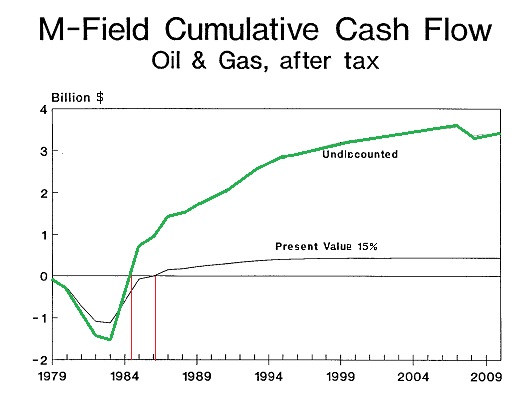
The cashflow graph shows the large effect the PV calculation has on the cashflow. It also shows the first years with the bulk of capital investment while the revenue from production is not counterbalancing this expense. The "pay-out time is shown by the vertical red lines: about 5 years for money of the day and about 7 years in pv terms. Note that an oil price scenario is included. The end value of the cumulative pv cashflow is the "PVNCS". This is used in ranking and cutoff calculations.